The Cities That Are Reopening the Fastest Following Lockdown
The choice to reopen cities across America during the pandemic involves a distinct tug-of-war between stemming further economic damage and inhibiting additional loss of life. There’s no question that the stakes are high. Open too soon and risk needlessly losing lives to the virus… Open too late and risk unnecessarily prolonging the nation’s economic backslide.
And as cities begin to open up after nearly two months of lockdown, most Americans are worried that social distancing measures are being lessened too quickly, rather than not quickly enough. Indeed, a recent survey by the Democracy Fund + UCLA Nationscape Project found that 71 percent, nearly three-fourths, of Americans feel this way. With the number of infections climbing daily across the country — albeit much slower than the peak in transmissions during mid-April — residents’ fears are justifiable.
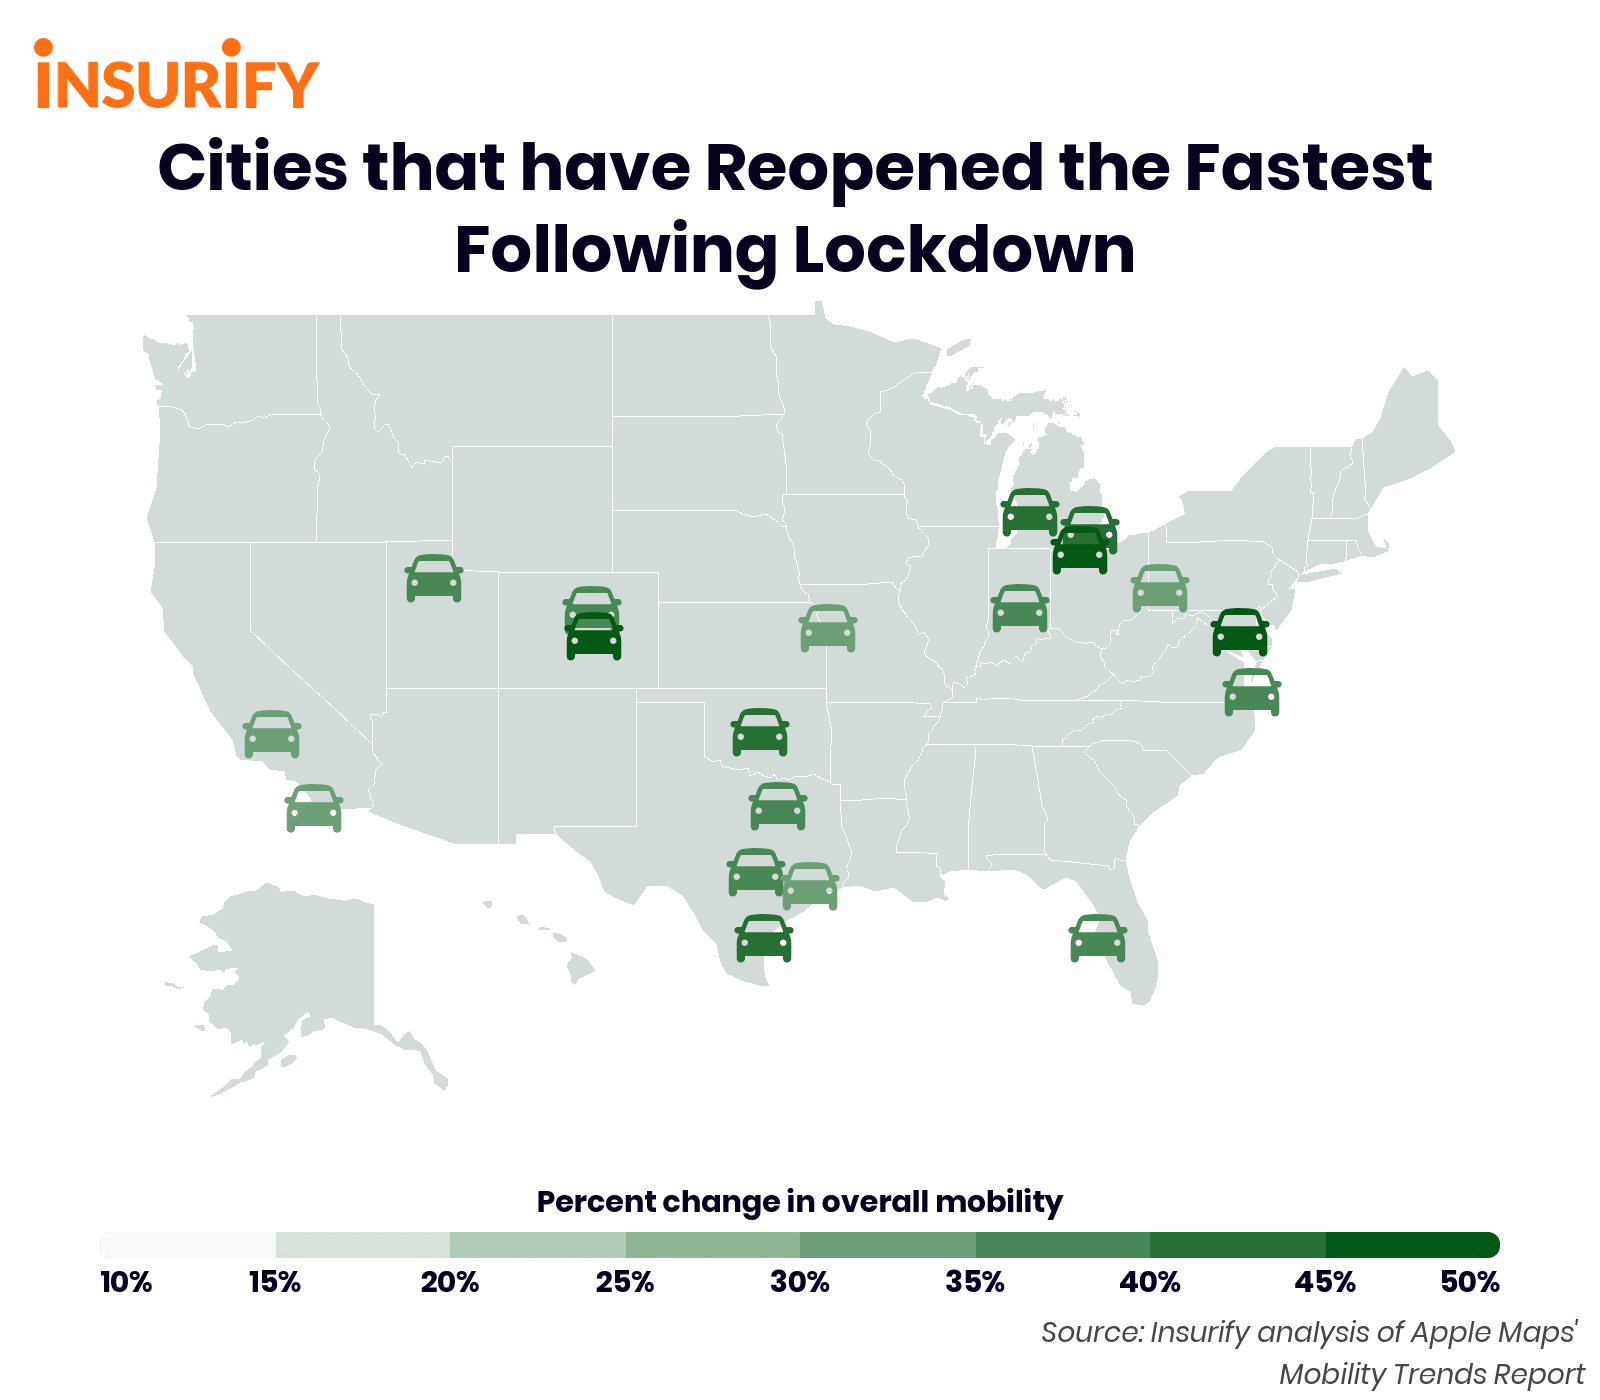
Regardless of when a city officially reopens, people “reopen” their activities at their own pace and may be slow to adopt relaxed social distancing measures outlined in policymakers’ plans. As such, residents’ relative mobility levels provide a more accurate timeline than reopening policies themselves. With this in mind, the data and research team at Insurify relied on behavioral data to determine the top twenty cities with the fastest rates of reopening.
Insights
- Average change in mobility across all cities. Across the 61 cities analyzed in this study, mobility has increased an average of 29 percent since lockdowns began to lift. As for walking, transit use, and driving, the average increase is 34, 12, and 41 percent, respectively.
- Cities with the slowest reopening since lockdown. On the opposite side of the spectrum are those cities that have reopened the most slowly following lockdown. Washington D.C., Portland (OR), and Phoenix (AZ) have had the lowest increase in mobility, at 16, 17, and 19 percent, respectively.
- Partisan divides and rates of opening up. By and large, the pace at which policymakers are easing social distancing recommendations is split along party lines. Curious to see whether political affiliation also affected mobility behavior, Insurify’s data science team performed an independent samples t-test on the cities in this study. They found that political affiliation (based on statewide voting patterns in the 2016 presidential election) has no effect on the relative in mobility in the cities in this study.
Methodology
The data science and research team at Insurify, a car insurance quotes comparison website, determined which cities have been the fastest to reopen based on driving, walking, and public transit data in 61 of America’s largest cities. Mobility data was provided by Apple Maps, which compares the daily volume of directions requests per city to a baseline volume on January 13, 2020. Data sent from users’ devices to Apple Maps services is anonymized.
Insurify’s research team grouped this mobility data into two date ranges, in order to compare the relative change in Apple Maps directions requests. The first, March 30 to April 24, is the period between when the first state (California) began to shelter in place to when the first state (Georgia) began to reopen. The second is an almost equal period from the first day that Georgia reopened to the present. The higher the percent change between periods, the greater the increase in direction requests, indicating a faster reopening of the city.

The Cities that are Reopening the Fastest following Lockdown
20. Omaha, Nebraska
- Overall mobility increase since lockdown: 31%
- Relative driving increase: 40%
- Relative transit increase: 11%
- Relative walking increase: 42%
19. Pittsburgh, Pennsylvania
- Overall mobility increase since lockdown: 31%
- Relative driving increase: 44%
- Relative transit increase: 17%
- Relative walking increase: 33%
18. Bakersfield, California
- Overall mobility increase since lockdown: 32%
- Relative driving increase: 39%
- Relative transit increase: 19%
- Relative walking increase: 37%
17. Houston, Texas
- Overall mobility increase since lockdown: 32%
- Relative driving increase: 43%
- Relative transit increase: 17%
- Relative walking increase: 37%
16. Kansas City, Missouri
- Overall mobility increase since lockdown: 32%
- Relative driving increase: 44%
- Relative transit increase: 10%
- Relative walking increase: 44%
15. San Diego, California
- Overall mobility increase since lockdown: 32%
- Relative driving increase: 40%
- Relative transit increase: 18%
- Relative walking increase: 37%
14. Austin, Texas
- Overall mobility increase since lockdown: 33%
- Relative driving increase: 43%
- Relative transit increase: 18%
- Relative walking change: 39%
13. Dallas, Texas
- Overall increase since lockdown: 33%
- Relative driving increase: 42%
- Relative transit increase: 18%
- Relative walking increase: 38%
12. Saint Petersburg – Clearwater, Florida
- Overall mobility increase since lockdown: 35%
- Relative driving increase: 50%
- Relative transit increase: 19%
- Relative walking increase: 37%
11. Indianapolis, Indiana
- Overall mobility increase since lockdown: 35%
- Relative driving increase: 44%
- Relative transit increase: 13%
- Relative walking increase: 47%
10. Denver, Colorado
- Overall mobility increase since lockdown: 37%
- Relative driving increase: 50%
- Relative transit increase: 20%
- Relative walking increase: 42%
9. Salt Lake City, Utah
- Overall mobility increase since lockdown: 37%
- Relative driving increase: 44%
- Relative transit increase: 22%
- Relative walking increase: 45%
8. Virginia Beach, Virginia
- Overall mobility increase since lockdown: 37%
- Relative driving increase: 40%
- Relative transit increase: 22%
- Relative walking increase: 49%
7. Corpus Christi, Texas
- Overall mobility increase since lockdown: 40%
- Relative driving increase: 59%
- Relative transit increase: 15%
- Relative walking increase: 47%
6. Detroit, Michigan
- Overall mobility increase since lockdown: 40%
- Relative driving increase: 59%
- Relative transit increase: 9%
- Relative walking increase: 52%
5. Grand Rapids, Michigan
- Overall mobility increase since lockdown: 41%
- Relative driving increase: 60%
- Relative transit increase: 17%
- Relative walking increase: 46%
4. Oklahoma City, Oklahoma
- Overall mobility increase since lockdown: 41%
- Relative driving increase: 45%
- Relative transit increase: 32%
- Relative walking increase: 46%
3. Colorado Springs, Colorado
- Overall mobility increase since lockdown: 44%
- Relative driving increase: 52%
- Relative transit increase: 38%
- Relative walking increase: 43%
2. Toledo, Ohio
- Overall mobility increase since lockdown: 44%
- Relative driving increase: 52%
- Relative transit increase: 31%
- Relative walking increase: 49%
1. Annapolis, Maryland
- Overall mobility increase since lockdown: 45%
- Relative driving increase: 42%
- Relative transit increase: 55%
- Relative walking increase: 38%
If you have questions or comments about this article, please contact insights@insurify.com.
More From Cool 98.7 FM